Reading DORA Metrics When AI Writes Half Your Commits

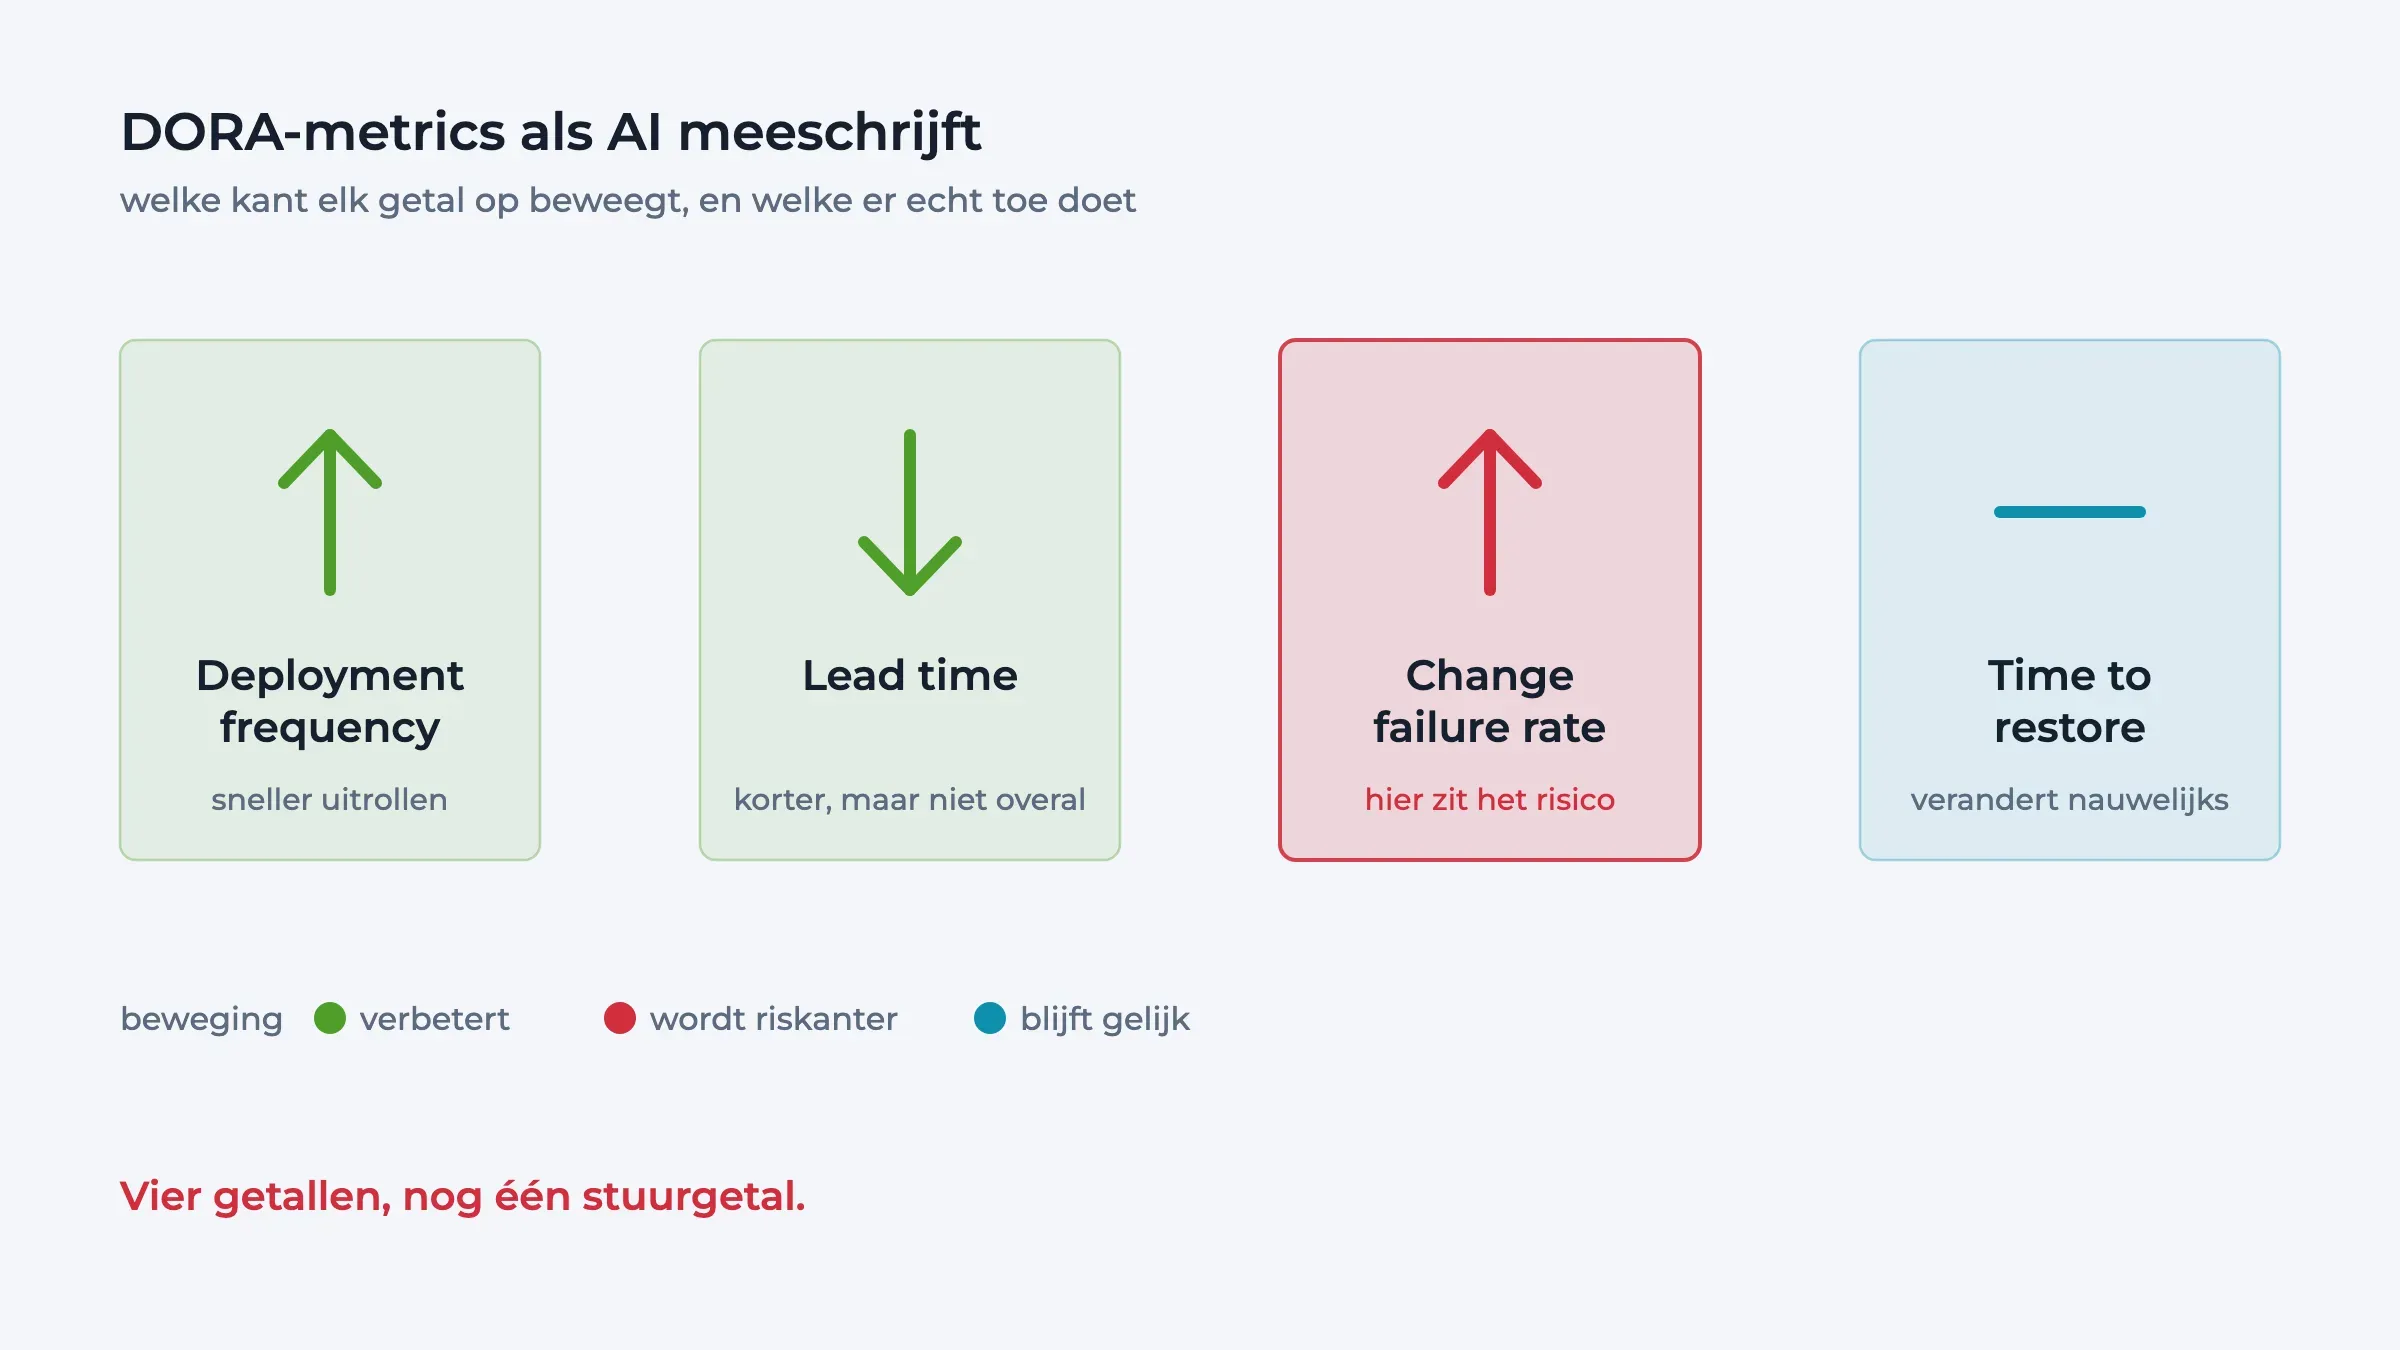
Your DORA dashboard still shows the same four numbers. They no longer mean the same thing.
Once a serious share of your code is not written by hand, what each of those metrics tells you shifts. Some go up without anything improving. One becomes far more important than the rest. And the naive reading ("our deployment frequency is climbing, so things are going well") points in exactly the wrong direction.
What DORA was built for
The four DORA metrics measure your delivery flow, not your productivity. That distinction always mattered; with AI in the mix it becomes decisive. DORA itself describes the four like this:
- Deployment frequency: how often you ship to production.
- Lead time for changes: how long from commit to production.
- Change failure rate: what share of changes cause problems.
- Time to restore: how quickly you recover when something breaks.
None of them measures how much code you write. That used to be a detail. Now it is the whole point: writing code is no longer your bottleneck, so a metric that ignores code volume is exactly what you want.
The speed side moves, and tells you least
Deployment frequency is the metric that moves fastest when you adopt AI tooling, and the one that misleads most easily. More changes get finished sooner, so more changes reach production. Your chart climbs. Somebody puts it in a deck. But deployment frequency measures motion, not progress. If the extra deploys are changes nobody asked for, or corrections to last week's changes, the chart is counting activity. So never read it without the change failure rate beside it. If both rise together, there is no gain, only more traffic.
Lead time for changes is a sum: thinking, writing, reviewing, testing, waiting for approval, deploying. AI reliably shortens exactly one of those steps. The others stay where they were. So your total lead time improves far less than expected, and the proportions inside that sum distort. Where writing might once have been a third of the elapsed time, it is now a fraction, and waiting on a reviewer or a pipeline has become proportionally dominant. That is the most useful thing this metric can tell you. Break lead time into phases as soon as you adopt AI seriously. Without that split you see one number improving slightly. With it, you see precisely where your next hour of gain is sitting.
The stability side: trust becomes the scarce thing
When code gets cheap to produce, it gets expensive to trust. That makes change failure rate the metric to watch hardest. Not because AI-written code is inherently worse (that argument is largely settled), but because there is more of it, arriving faster, with fewer people who have genuinely read every line. Two things to watch. First, a rise that coincides with your AI rollout: that is the signal that your speed has outrun your controls. Second, and subtler, a change failure rate that stays flat while deployment frequency doubles. In absolute terms that is twice the incidents, which percentages hide.
Time to restore is the metric least affected by AI tooling, which is exactly what makes it informative. Recovering from an incident depends on your observability, your runbooks, your rollback paths and whether the right person is reachable. A model that writes code faster touches none of that. So if deployment frequency rises, lead time falls, and time to restore sits exactly where it was, you have scaled the speed side of your system without scaling the risk side. That is a perfectly fine position to be in as long as you know it, and an excellent way to be surprised if you are not measuring it.
What to measure alongside it, and how to set it up
DORA still holds, but it is no longer sufficient on its own. Three additions that earn their place in an AI-heavy workflow:
-
Review latency. Time between "ready for review" and "reviewed". In most teams this is now the single largest component of lead time, and it is rarely tracked separately.
-
Rework ratio. What share of changes get touched again within, say, two weeks. If this climbs while you ship faster, you are producing repair work rather than progress.
-
Share of AI-assisted changes. You do not need to trace every line; without some indication you cannot say anything about what AI actually bought you. Even a coarse flag at PR level is the difference between measuring and guessing.
Start with a baseline before you roll AI tooling out widely. Without it you can prove nothing afterwards, and that is precisely where most arguments about AI investment stall: everyone has an opinion, nobody has a chart from before. Then split lead time into phases, and put review latency and rework ratio beside it. Always read change failure rate in absolute counts as well as percentage. This is the kind of measurement Agile Analytics, our measurement engine, exists for: DORA and SPACE side by side with the phases broken out, so you can see where your elapsed time actually goes rather than one summarised number.
Measure it before you celebrate it
AI does not change your DORA metrics. It changes what they mean: deployment frequency becomes sensitive to noise, lead time shifts from writing to waiting, change failure rate becomes your key signal, and time to restore reveals whether your risk controls grew with your speed.
My prediction: the teams that can show a year from now what AI delivered will not be the teams with the highest deployment frequency. They will be the teams that took a baseline before the rollout and broke their lead time into phases. The rest will have a chart that goes up and an argument that goes nowhere. So decide now, before the tooling is everywhere, which of those two groups you want to be in.
Happy Nerds are productive Nerds
Implement DevOps and SRE super fast with Agile Analytics. Ask our Agile Nerds.
AI engineering
Use AI where it genuinely helps, with accountability staying with people.
Read more:

AI-Assisted Development under GDPR, NIS2 and DORA
The moment you attach a coding agent to your codebase, you touch three regulatory regimes at once. Not because AI is sep...
In 1988 a student took down a tenth of the internet. What did we do next?
In November 1988 a student at Cornell wrote a small program to count how many computers were on the internet. A bug took...
OpenAI's AI agents broke into another company. So why are we calling it a conspiracy?
OpenAI's AI agents broke into Hugging Face, another AI company, this summer. Dwarkesh Patel called it an AI civilisation...
A $200 AI subscription delivers $14,000 of compute. But does the maths hold up?
A $200 ChatGPT Pro subscription supposedly delivers $14,000 a month of compute. That is how the screenshot goes round. I...

Reviewing AI-Generated Infrastructure Code: What to Actually Look For
Application code that is wrong usually breaks. Infrastructure code that is wrong works. And that is exactly the problem....
What Thirty Minutes of Waiting per Engineer per Day Really Costs
Half an hour a day. It sounds like nothing. But work it through and it is €5,000 per engineer per year, or half a millio...